Retail sales taxes account for 32% of state tax collections, 13% of municipal tax collections, and 24% of all tax collections, making them a crucial component of most states' revenue strategies. Additionally, since they generate fewer economic distortions than the individual income tax, the other significant state tax, they are more pro-growth.
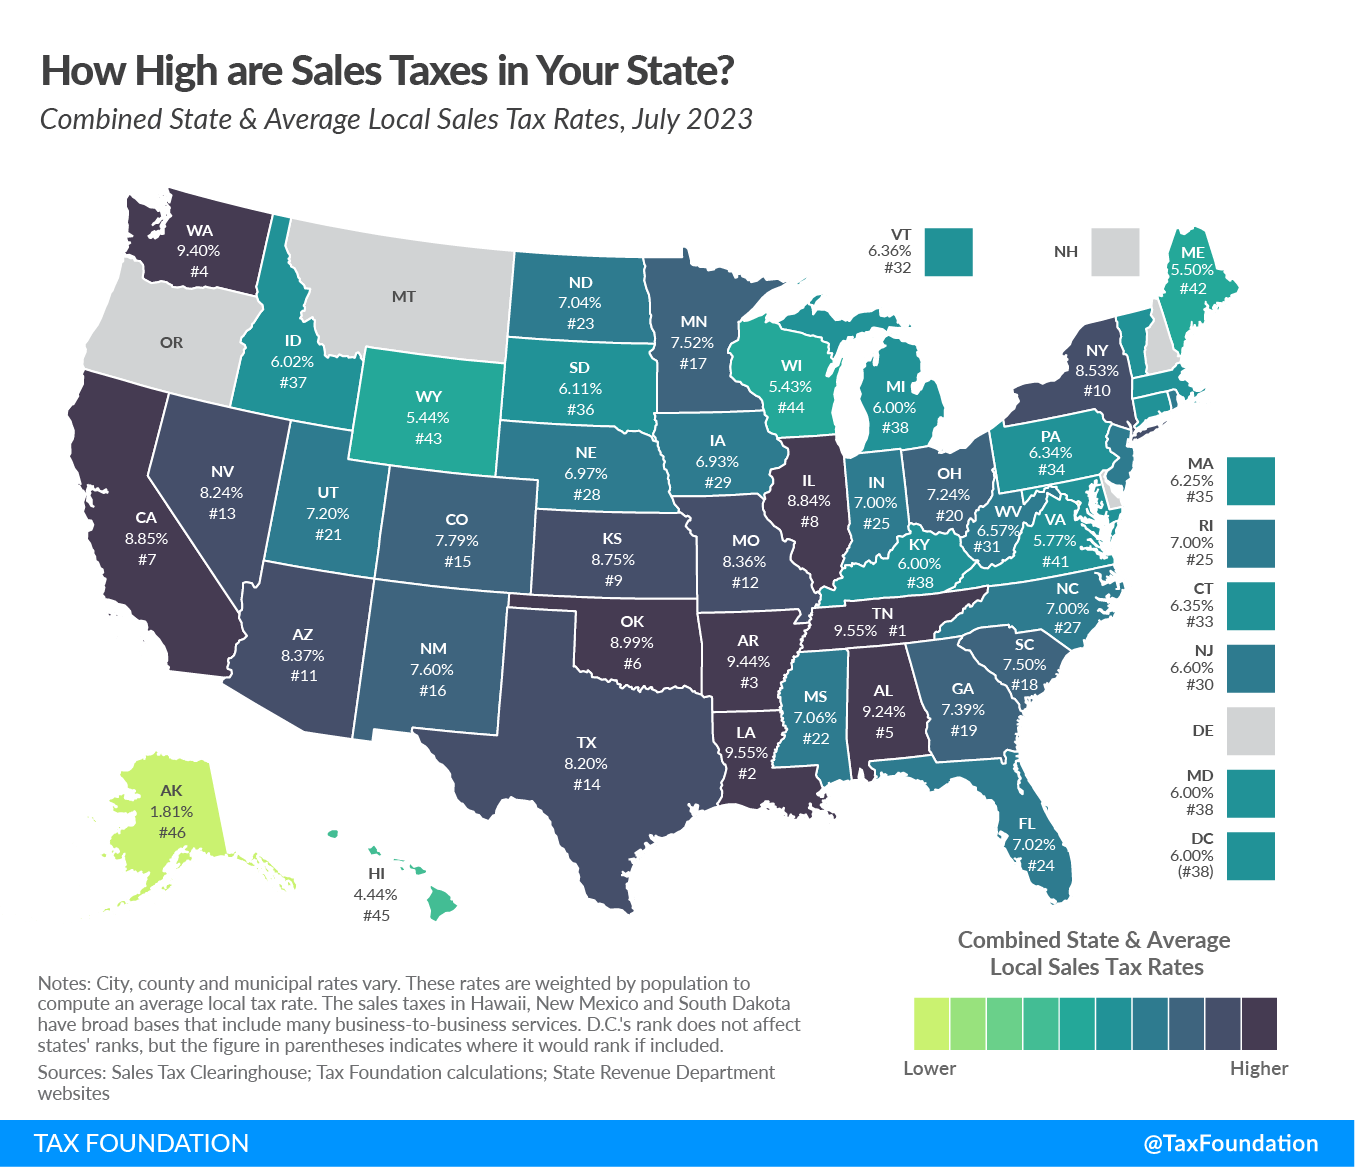
Customers must pay local sales taxes in 38 states, including Alaska, which has no statewide sales tax, while 45 states impose state-level sales taxes. These municipal rates can be significant, and in some areas with moderate statewide sales tax rates, the combined state and local rates are really fairly high when compared to rates in other states. To provide readers an idea of the typical local rate for each state, this report presents a population-weighted average of local sales taxes as of July 1, 2023. The full breakdown of state and local sales tax rates is shown in Table 1.
Combined Rates
Alaska, Delaware, Montana, New Hampshire, and Oregon are the only five states without a statewide sales tax. Only Alaska permits towns to implement local sales taxes among them.
Tennessee (9.548 percent), Louisiana (9.547 percent), Arkansas (9.44 percent), Washington (9.40 percent), and Alabama (9.24 percent) are the five states with the highest average combined state and local sales tax rates. Alaska (1.81 percent), Hawaii (4.44 percent), Wisconsin (5.43 percent), Wyoming (5.44 percent), and Maine (5.50 percent) have the five states with the lowest average total rates.
State Rates
At 7.25 percent, California has the highest state-level sales tax rate. With a statewide rate of 7%, Indiana, Mississippi, Rhode Island, and Tennessee are in a tie for second place. Colorado has the lowest non-zero state-level sales tax, with a rate of 2.9 percent. Following Alabama, Georgia, Hawaii, New York, and Wyoming are five states with 4 percent rates.
This year, only South Dakota's state sales tax was reduced. In an unusual move, the decrease—from 4.5 to 4.2 percent—is just temporary and will end after four years. The Mount Rushmore State joins New Mexico in reducing its gross receipts tax, a hybrid tax that the state calls its state-level sales tax, from 5.125 percent to 5 percent in July 2022. Notably, the state's rate will return to 5.125 percent on July 1 of the following year if the gross receipts tax income in any fiscal year from 2026 to 2029 is less than 95% of the revenue from the prior year.
Before that, Louisiana's rate cut in July 2018 from 5.0 to 4.45 percent represented the most recent statewide rate reduction. State legislators have placed a higher priority on income tax cuts, which are more beneficial to the economy. In the last two years alone, individual or corporate income tax rates have been reduced in 20 states.
Local Rates
Alabama (5.24 percent), Louisiana (5.10 percent), Colorado (4.89 percent), New York (4.53 percent), and Oklahoma (4.49 percent) are the five states with the highest average local sales tax rates.
Since January, only Vermont and South Dakota have moved up the rankings more than once. Vermont fell three places as a result of local rate increases, whereas South Dakota rose four spots overall thanks to its lower state rate. Florida, Illinois, and Wisconsin also rose one slot, while Tennessee, North Dakota, Wyoming, and California fell one spot as a result of local sales tax changes in those states or those of their closest neighbors.
In Vermont, the combined rate rose as a result of rate hikes that were passed by the voters of Shelburne, Stowe, and Rutland. Sweetwater County, Wyoming, approved a new tax of 1%. Voter-approved initiatives in California raised rates in various localities, including Malibu (0.5%), Modesto (1%) and some areas of Kern (1%) among others.
In order to help local businesses compete with Delaware, which has no sales tax, several cities in New Jersey are designated as "Urban Enterprise Zones," where qualified merchants may collect and remit at a rate that is half that of the state as a whole (6.625%) (3.3125%). According to the methodology section below, we adjust the combined rate for population and depict this anomaly as a negative 0.03 percent statewide average local rate. Despite the somewhat positive effect on the total rate, New Jersey officials are implicitly admitting that their 6.625 percent statewide rate is too high compared to Delaware's absence of a sales tax.
| State | State Tax Rate | Rank | Avg. Local Tax Rate | Combined Rate | Rank | Max Local Tax Rate |
|---|---|---|---|---|---|---|
| Alabama | 4.00% | 40 | 5.237% | 9.237% | 5 | 7.50% |
| Alaska | 0.00% | 46 | 1.813% | 1.813% | 46 | 7.50% |
| Arizona | 5.60% | 28 | 2.771% | 8.371% | 11 | 5.30% |
| Arkansas | 6.50% | 9 | 2.943% | 9.443% | 3 | 6.13% |
| California (a) | 7.25% | 1 | 1.601% | 8.851% | 7 | 4.75% |
| Colorado | 2.90% | 45 | 4.891% | 7.791% | 15 | 8.30% |
| Connecticut | 6.35% | 12 | 0.000% | 6.350% | 33 | 0.00% |
| Delaware | 0.00% | 46 | 0.000% | 0.000% | 47 | 0.00% |
| Florida | 6.00% | 17 | 1.019% | 7.019% | 24 | 2.00% |
| Georgia | 4.00% | 40 | 3.394% | 7.394% | 19 | 5.00% |
| Hawaii (b) | 4.00% | 40 | 0.443% | 4.443% | 45 | 0.50% |
| Idaho | 6.00% | 17 | 0.021% | 6.021% | 37 | 3.00% |
| Illinois | 6.25% | 13 | 2.588% | 8.838% | 8 | 4.75% |
| Indiana | 7.00% | 2 | 0.000% | 7.000% | 25 | 0.00% |
| Iowa | 6.00% | 17 | 0.934% | 6.934% | 29 | 1.00% |
| Kansas | 6.50% | 9 | 2.250% | 8.750% | 9 | 4.25% |
| Kentucky | 6.00% | 17 | 0.000% | 6.000% | 38 | 0.00% |
| Louisiana | 4.45% | 37 | 5.097% | 9.547% | 2 | 7.00% |
| Maine | 5.50% | 29 | 0.000% | 5.500% | 42 | 0.00% |
| Maryland | 6.00% | 17 | 0.000% | 6.000% | 38 | 0.00% |
| Massachusetts | 6.25% | 13 | 0.000% | 6.250% | 35 | 0.00% |
| Michigan | 6.00% | 17 | 0.000% | 6.000% | 38 | 0.00% |
| Minnesota | 6.88% | 6 | 0.648% | 7.523% | 17 | 2.00% |
| Mississippi | 7.00% | 2 | 0.062% | 7.062% | 22 | 1.00% |
| Missouri | 4.23% | 38 | 4.137% | 8.362% | 12 | 5.88% |
| Montana (c) | 0.00% | 46 | 0.000% | 0.000% | 47 | 0.00% |
| Nebraska | 5.50% | 29 | 1.471% | 6.971% | 28 | 2.00% |
| Nevada | 6.85% | 7 | 1.386% | 8.236% | 13 | 1.53% |
| New Hampshire | 0.00% | 46 | 0.000% | 0.000% | 47 | 0.00% |
| New Jersey (d) | 6.63% | 8 | -0.024% | 6.601% | 30 | 3.31% |
| New Mexico (b) | 4.88% | 34 | 2.726% | 7.601% | 16 | 4.06% |
| New York | 4.00% | 40 | 4.532% | 8.532% | 10 | 4.88% |
| North Carolina | 4.75% | 35 | 2.246% | 6.996% | 27 | 2.75% |
| North Dakota | 5.00% | 32 | 2.038% | 7.038% | 23 | 3.50% |
| Ohio | 5.75% | 27 | 1.488% | 7.238% | 20 | 2.25% |
| Oklahoma | 4.50% | 36 | 4.486% | 8.986% | 6 | 7.00% |
| Oregon | 0.00% | 46 | 0.000% | 0.000% | 47 | 0.00% |
| Pennsylvania | 6.00% | 17 | 0.341% | 6.341% | 34 | 2.00% |
| Rhode Island | 7.00% | 2 | 0.000% | 7.000% | 25 | 0.00% |
| South Carolina | 6.00% | 17 | 1.499% | 7.499% | 18 | 3.00% |
| South Dakota (b) | 4.20% | 39 | 1.908% | 6.108% | 36 | 4.50% |
| Tennessee | 7.00% | 2 | 2.548% | 9.548% | 1 | 2.75% |
| Texas | 6.25% | 13 | 1.948% | 8.198% | 14 | 2.00% |
| Utah (a) | 6.10% | 16 | 1.098% | 7.198% | 21 | 4.20% |
| Vermont | 6.00% | 17 | 0.359% | 6.359% | 32 | 1.00% |
| Virginia (a) | 5.30% | 31 | 0.467% | 5.767% | 41 | 2.70% |
| Washington | 6.50% | 9 | 2.897% | 9.397% | 4 | 4.10% |
| West Virginia | 6.00% | 17 | 0.566% | 6.566% | 31 | 1.00% |
| Wisconsin | 5.00% | 32 | 0.429% | 5.429% | 44 | 1.75% |
| Wyoming | 4.00% | 40 | 1.441% | 5.441% | 43 | 2.00% |
| D.C. | 6.00% | 0.000% | 6.000% | 0.000% | ||
|
Note: City, county and municipal rates vary. Local rates are weighted by population to compute an average local tax rate. (a) Three states levy mandatory, statewide, local add-on sales taxes at the state level: California (1%), Utah (1.25%), and Virginia (1%). We include these in their state sales tax. (b) The sales taxes in Hawaii, New Mexico, and South Dakota have broad bases that include many business-to-business services. (c) Special taxes in local resort areas are not counted here. (d) Salem County, N.J., is not subject to the statewide sales tax rate and collects a local rate of 3.3125%. New Jersey’s local score is represented as a negative. Sources: Sales Tax Clearinghouse; Tax Foundation calculations; State Revenue Department websites. |
||||||
The Role of Competition in Setting Sales Tax Rates
Avoiding sales tax is most likely to happen in regions where rates between jurisdictions fluctuate significantly. According to research, people can and do move from high-tax to low-tax areas to make significant purchases, like from cities to suburbs. For instance, data suggests that consumers in the Chicago area shop online or in nearby suburbs for large purchases to avoid the city's 10.25 percent sales tax.
Businesses occasionally choose to locate statewide just outside the boundaries of high sales-tax districts to avoid having to pay their rates. A striking illustration of this may be found in New England, where many more retail enterprises opt to locate on the New Hampshire side of the Connecticut River in order to avoid paying sales taxes, despite the fact that I-91 runs up the Vermont side of the river. According to one study, border counties in Vermont have seen a stagnation in per capita sales whereas border counties in sales tax-free New Hampshire have seen a threefold increase since the late 1950s. Delaware once utilized its highway welcome sign to inform passing cars that it is the "Home of Tax-Free Shopping."
State and municipal governments should be careful when increasing rates because doing so will result in lower than anticipated revenue or, in extreme situations, revenue losses despite the higher tax rate.
Sales Tax Bases: The Other Half of the Equation
As opposed to taking into account variations in tax bases (such as the design of sales taxes or the definition of what is taxable and nontaxable), this study evaluates states according to their tax rates. In this sense, states can differ substantially. For instance, most states do not impose a sales tax on food, while others do so at a reduced rate or at the same rate as all other goods. Some states either exclude or tax garments at a lower rate.
Generally speaking, tax experts advise that sales taxes should be applied to final retail sales of products and services and not to earlier business-to-business exchanges in the manufacturing chain. These suggestions would lead to a tax structure that is not only well-rounded but also "right-sized," meaning that it would only be applied once to each good that the market creates. Although there is agreement in theory, most state sales taxes are not applied in this ideal manner.
Hawaii has the broadest sales tax in the country, yet many goods are taxed more than once, according to one estimate, and 119 percent of the state's personal income is eventually subject to taxation. Compared to the national median, where the sales tax accounts for 36% of personal income, this base is significantly larger.
Methodology
Sales Tax Clearinghouse distributes quarterly sales tax information broken down by ZIP code for states, counties, and cities. To get a sense of the prevalence of sales tax rates in a given state, we weight these values based on the most recent population estimates from the Census 2021. In prior versions, we used data that was accessible every ten years. While the majority of the adjustments brought about by the new weighting were minor, we nonetheless display rank changes based on January 1 statistics that were recalculated using the new population weighting. This report is not exactly comparable to earlier versions due to the changed population weighting, however the variations are mostly rounding errors.
It should be noted that although the Census Bureau uses a five-digit identification number that closely resembles a ZIP code to publish population statistics, this is actually a ZIP Code Tabulation Area (ZCTA), which aims to establish a physical area connected to a specific ZIP code. This is carried out due to the startling prevalence of ZIP codes devoid of any inhabitants. The National Press Building in Washington, D.C., for instance, has its own ZIP code just for postal purposes.
For our estimates, ZIP codes without a corresponding ZCTA population figure are excluded. These omissions cause some inexactitude, but they don't generally have a big impact on the averages that are produced because nearby ZIP codes that do include ZCTA population data include the tax rates of those jurisdictions.
Conclusion
Sales taxes should be taken into account in the context of a larger tax system. For instance, Oregon has no sales tax but high income taxes, whereas Tennessee has high sales taxes but no income tax. Sales taxes are something that politicians can regulate and can have immediate effects, even though many factors affect where businesses locate and where investors choose to invest.


